Work at Specere Labs
This year, I am working at Purdue University, in Specere labs. My project is using spectroscopy and machine learning to detect toxins in drinking water! Specifically, per- and poly-fluoroalkyl substances, or PFAs.
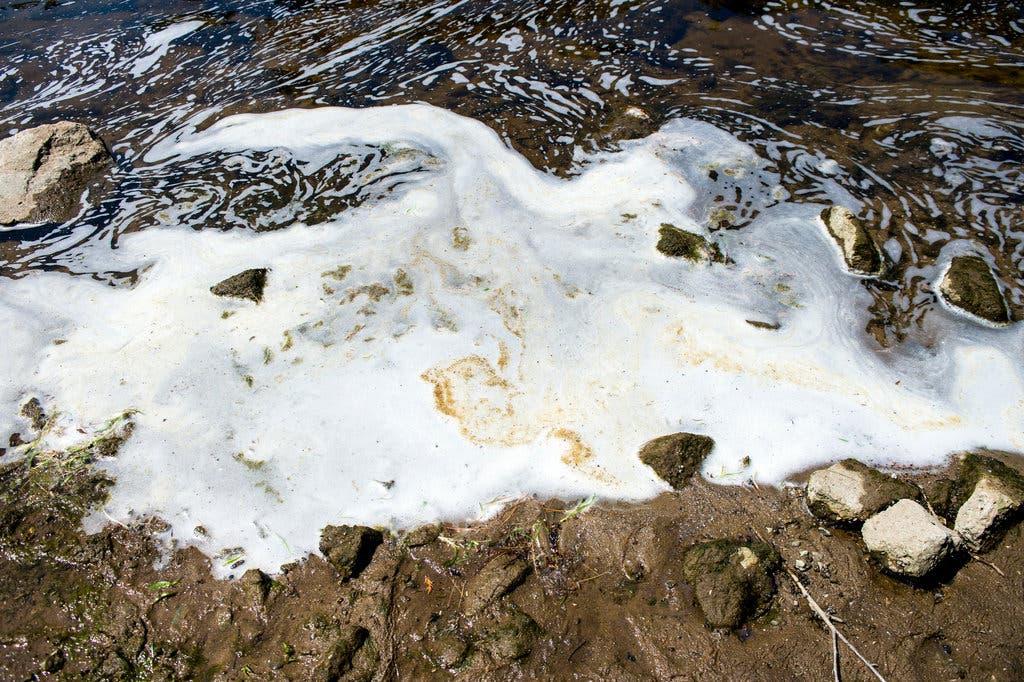
PFAs are prevalent contaminants that do not easily break down in the human body and cause harm throughout their nearly infinite lifetime, so they are called 'forever chemicals. They are found on clothes and non-stick pans. If large amounts of PFAs are contaminating a water system, they will create a visible 'foam' as you can see in this image of the water in Oscoda Township, Michigan. Most PFA contamination is invisible however, which makes it even more dangerous because it is hard to tell if the water is contaminated.
Yes, I know - both 'machine learning' and 'forever chemicals' are buzzwords. But rest assured, despite tremendous pressure from our investors we will NOT be providing microservices or moving this onto the blockchain or even the cloud. Also, we don't have investors yet because this is very early-stage research.
The environmental protection agency (EPA) has endorsed several PFA detection methods, which utilize mass spectrometry. Mass spectrometry is the most common method used for detecting substances because of its high accuracy. The way it works it:
- The spectrometer 'ionizes' the substance, giving it an electric charge
- It separates the ionized substance into different gasses based on the ratio of the mass of the gas to its charge
- Finally, the spectrometer reports the ratio of the ionized substances and from this, you can tell the composition of a substance. Or in this case, if it contains PFAs.
However, is a problem with this: it's expensive, which bars poorer communities from using it. It also limits its use in general since mass spectrometry is a process that typically requires the involvement of a university or major national laboratory, because where else are you going to get a spectrometer? Most people don't have one lying around. Purdue is equipped with 'miniature' mass spectrometers, but even the minature ones are still large and expensive.
One solution is to use spectroscopy. Spectroscopy is pronounced similarly to spectrometry but is quite different. Spectrometry is a very fancy color analyzer. It shines several lights on a substance and sees what is absorbed and what is transmitted. From this, you can learn about the substance's composition, temperature, pressure, and more. We hope to use it to see if PFAs are present. Purdue University uses a Fourier Transform Infrared Spectroscopy system. I have no idea how it works but it is very expensive.
Other labs have done this but it typically requires an entire spectroscopy system which isn't much better than a spectrometer in terms of expense. This is where machine learning comes in, or at least data science. We are trying to compress the data so that the spectroscopy lab is unnecessary, and you only need a few tools. To accomplish this we are attempting to reduce the dimensions via Principal Component Analysis, as well as other tools which I'll discuss in later posts.
Principal Component analysis, or PCA, is a way of reducing the dimensions of data. Most people think of dimensions as locations in space, but they can also mean locations in information space. Let's say you only know two things about something. You can then turn the first thing into the x dimension and the second thing into the y dimension, and use that to make a 2D plot.

Let's say you then learn a third thing! You can make that third thing the z dimension and plot it in 3d. But what if you discover a fourth thing? If you plot it in 4 dimensions, you can still use all the math which would be applied to a 2d or 3d plot. For example, you can find the average hight, and the slope of the plane (called a hyperplane in more than 3 dimensions) and use various other plotting algorithms. You can't see it visually or intuitively understand it, but the math still works.
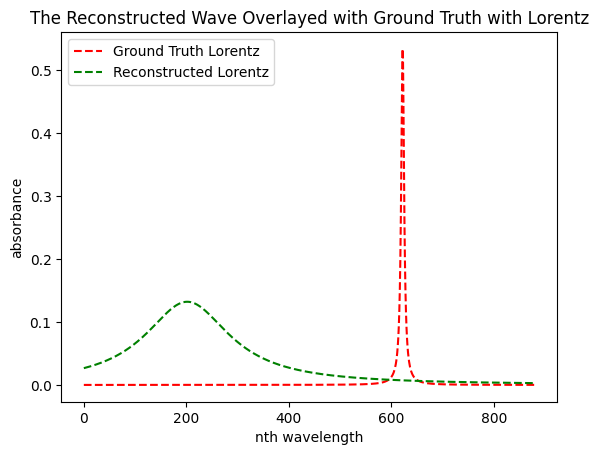
However, what if you have something with 880 dimensions, a lot of which are probably unnecessary? That is our situation because we are analyzing 880 different shades of color, giving us 880 data points. Principal Component Analysis finds the "maximum variance". It compresses the 880 dimensions down to 10 or so (i could set it to lower but 10 is working well) and figures out how to compress the data along the most interesting axis.
Unfortunately, it is not working. Below you can see a curve, and next to it, and attempt to use our math to replicate that curve. So... it's not going well. But that's just how research works!